If you are looking for a quick and easy way to display trend data for a period of time, like stock prices, the best chart to use is the line chart and its variants. Excel comes the option to chart data using various line charts that allow you to customize the look and feel of the chart based on your needs. The tools to customize charts are too many and will be covered in more detail in upcoming how-to guides. In the meantime review this how-to so that you can learn how to create line charts in Excel.
I am attaching the Excel spreadsheet I used for this tutorial so that you can follow along.
Download Excel Spreadsheet of Microsoft Stock Prices – msft-stocks-line-graph
Note: I used Excel 2010 in this tutorial, but these instructions will apply to Excel 2007 as well.
Create a Line Chart in Excel
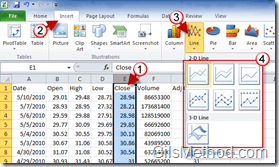
1. Click on the Row of data you wish to include in the line chart.
2. Click on the Insert tab in the Office Ribbon.
3. Click on the Line button in the Charts group.
4. Click on the Line Chart type you wish to use.
When you click on the Line Chart type a chart representing the selected data will appear. The chart is sitting in the same sheet the data is listed, let’s move the chart to it’s own sheet.
How to Move the Chart to Another Location
Moving the chart to its own sheet helps you keep the data and the charts organized. It also helps when you are printing just the charts for handouts, etc.
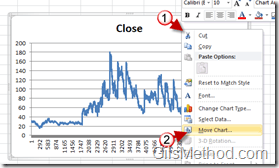
1. Right-click on the chart you just created.
2. Click on Move Chart from the menu.
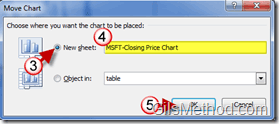
3. Select New sheet:
4. Name the new sheet.
5. Click OK to complete the move.
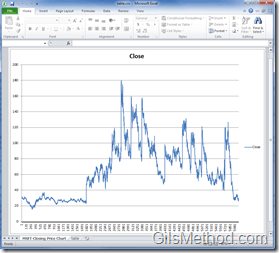
The chart should now be in its own sheet.
Customize the Chart
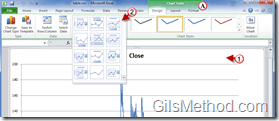
When you click on the chart you will notice that the Office Ribbon changes and now displays Chart Tools in Green. Under Chart Tools you will find three tabs that are specific to customizing the chart.
1. Click on the chart to make sure the Chart Tools are visible.
2. In the Design tab, click on the a Chart layout in the Chart Layouts group.
Use the rest of the tools to customize the look and feel of your chart.

